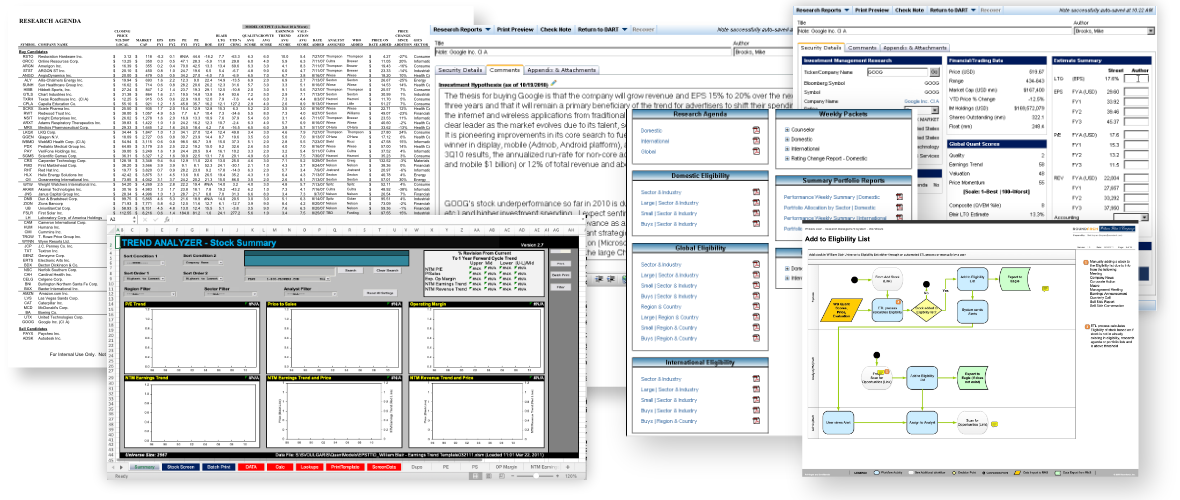
William Blair had a wealth of research and information for securities that were stored in a format that made it difficult for Analysts, Portfolio Managers and Traders to find, search for, or retrieve.
How might we create a centralized system that surfaces up-to-the-minute opinions, decisions, reports, portfolios and research lists across all job functions in a dynamic view in order to better leverage all insights within the group?
My Contribution
I led a team of User Experience and Visual Designers through the discovery, user research, conceptual design, detailed design and visual design phases.
The Team
Three User Experience Designers, two Visual Designers, two Front End Engineers, a Technical Architect, and a Back End Engineer.
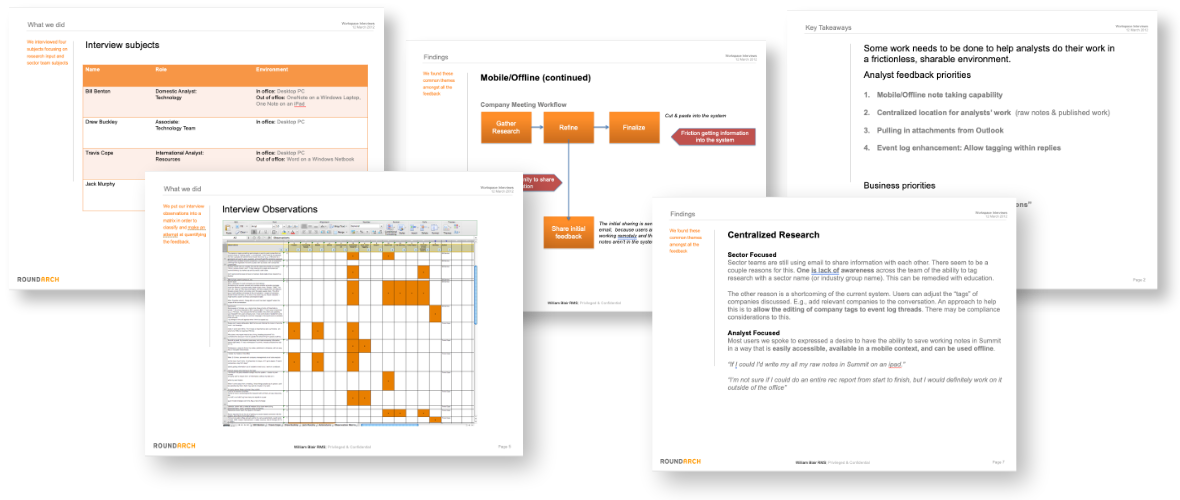
After aligning on problem and project scope with William Blair's stakeholders, we began our discovery and user reseach phase. Wrote scripts, andidentified internal interview subjects. We interviewed seven Research Analysts, four Portfolio Managers, and a Director of Research (who was also our project sponsor).
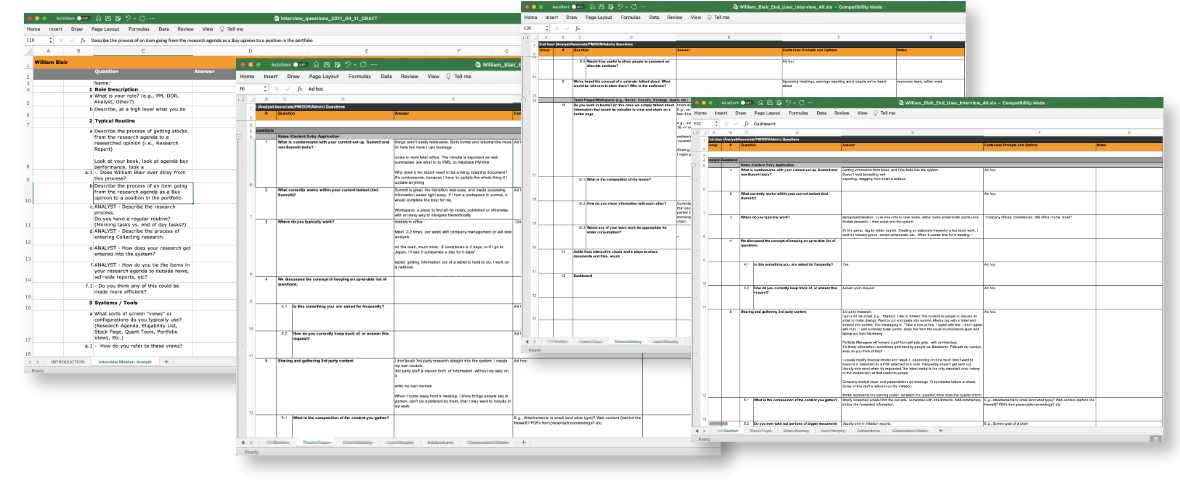
In addition to user interviews, we reviewed existing systems, observed our interview subjects at work, in order to witness workflows and ask ad-hoc questions.
After a few weeks of research, observation, and analysis we landed on a few core tenets:
All internal documents, portfolios, lists, commentary, and other tools needed to be brought online, and centrally located.
Internal research, such as Recommendation Reports, Research Agendas, and Commentary needed to be editable and updatable, with a history of authors.
User Customization for things like dashboards, watchlists, and alerts.
Workflow Customization such as submit trade instruction, add to / remove from the research agenda, and request analysis.
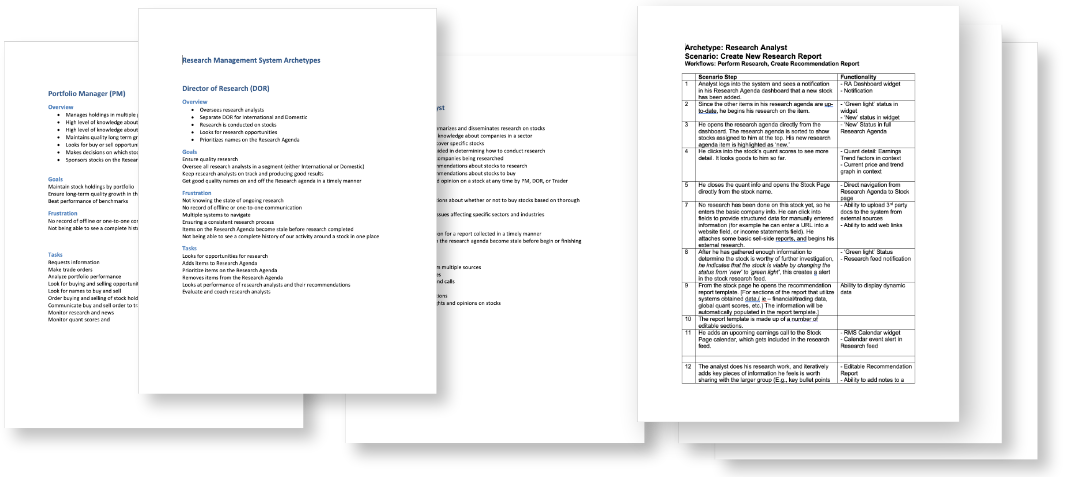
After aligning on problem and project scope with William Blair's stakeholders, we began our design phase, beginning with models of our users (personas) and models of typical tasks they performed (scenarios).
We focused on the following core personas:
We focused on developing the following high-impact scenarios:
After iterating the scenarios and personas with representative users and the client, we felt ready to begin illustrating how these features would function and behave in the to-be system.
We started by blocking out the types of data being used for different scenario steps. We identified common use patterns, and began sketching early feature models.
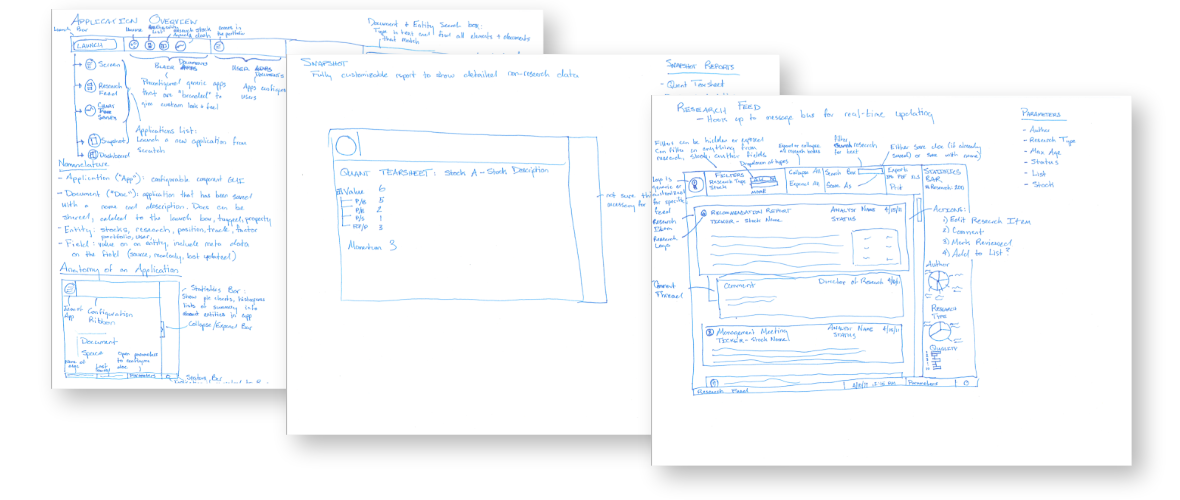
Each scenario step was accounted for on our conceptual designs. This exercise brings the scenarios to life to the client , design, and technical teams alike, and allows us to collaborate and improve a design as a collaborative group.
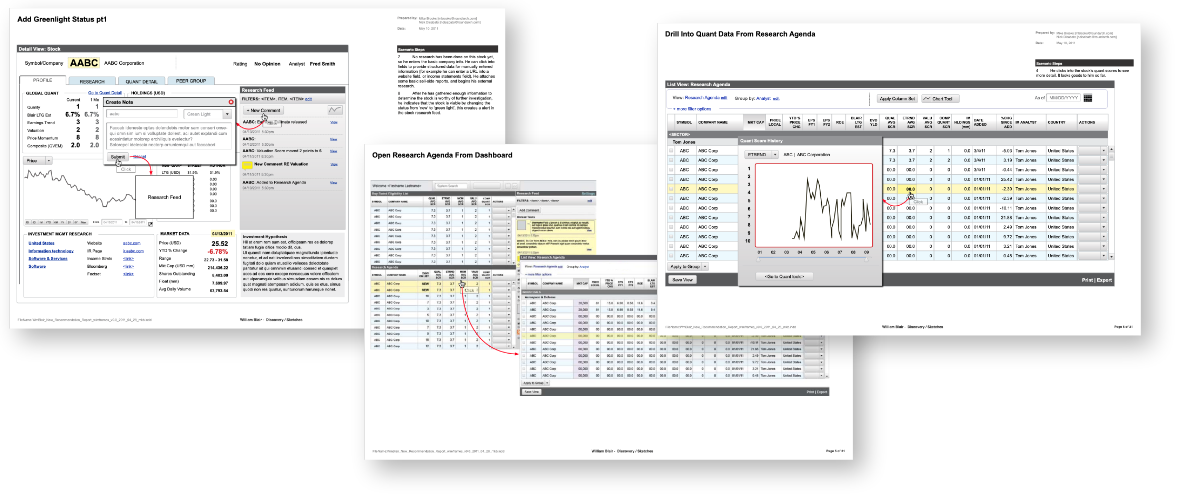
As the feature models and components started to take shape, we began working on visual style and UI patterns.
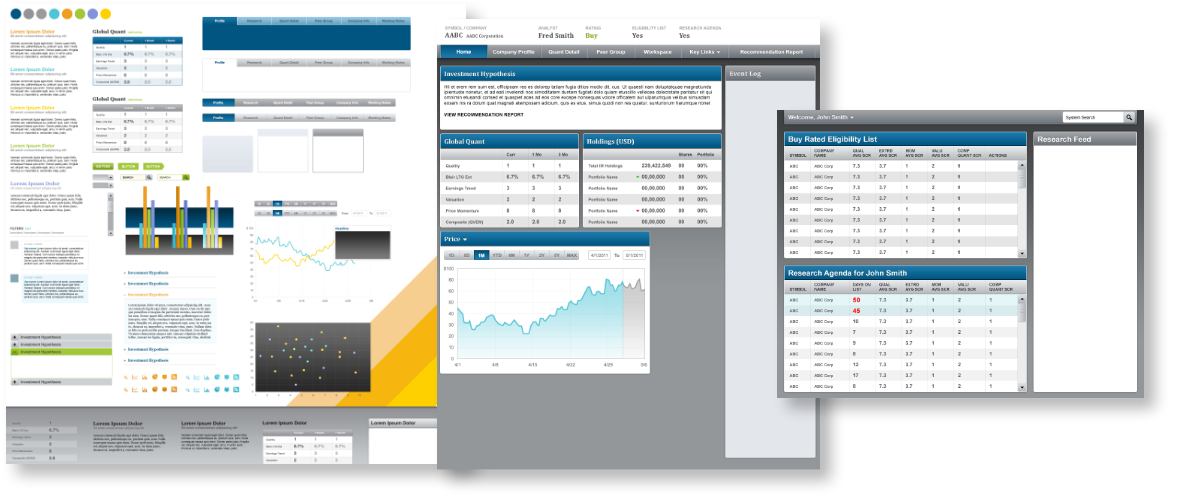
Focused on the main system components: Lists, Stock Page, Event Log, Portfolio Tool, and Trade Instructions
Components
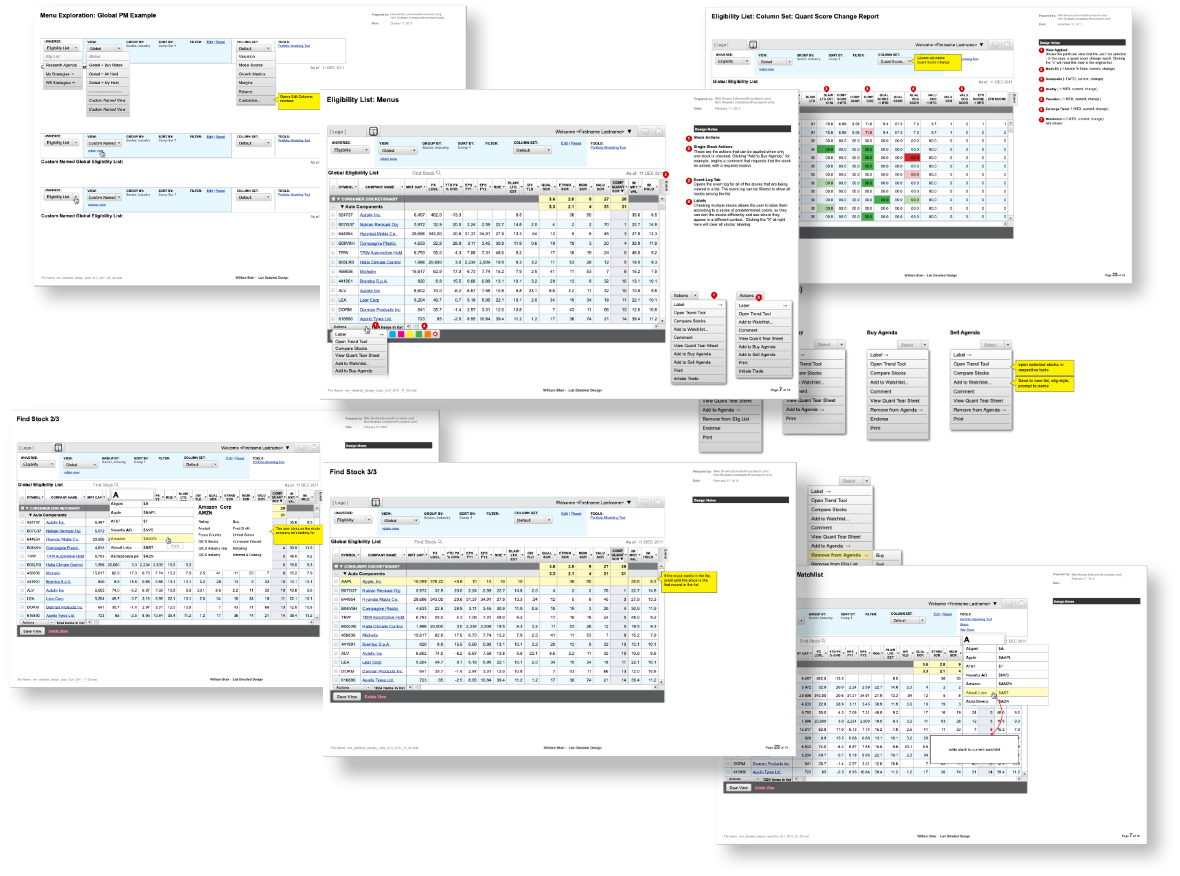
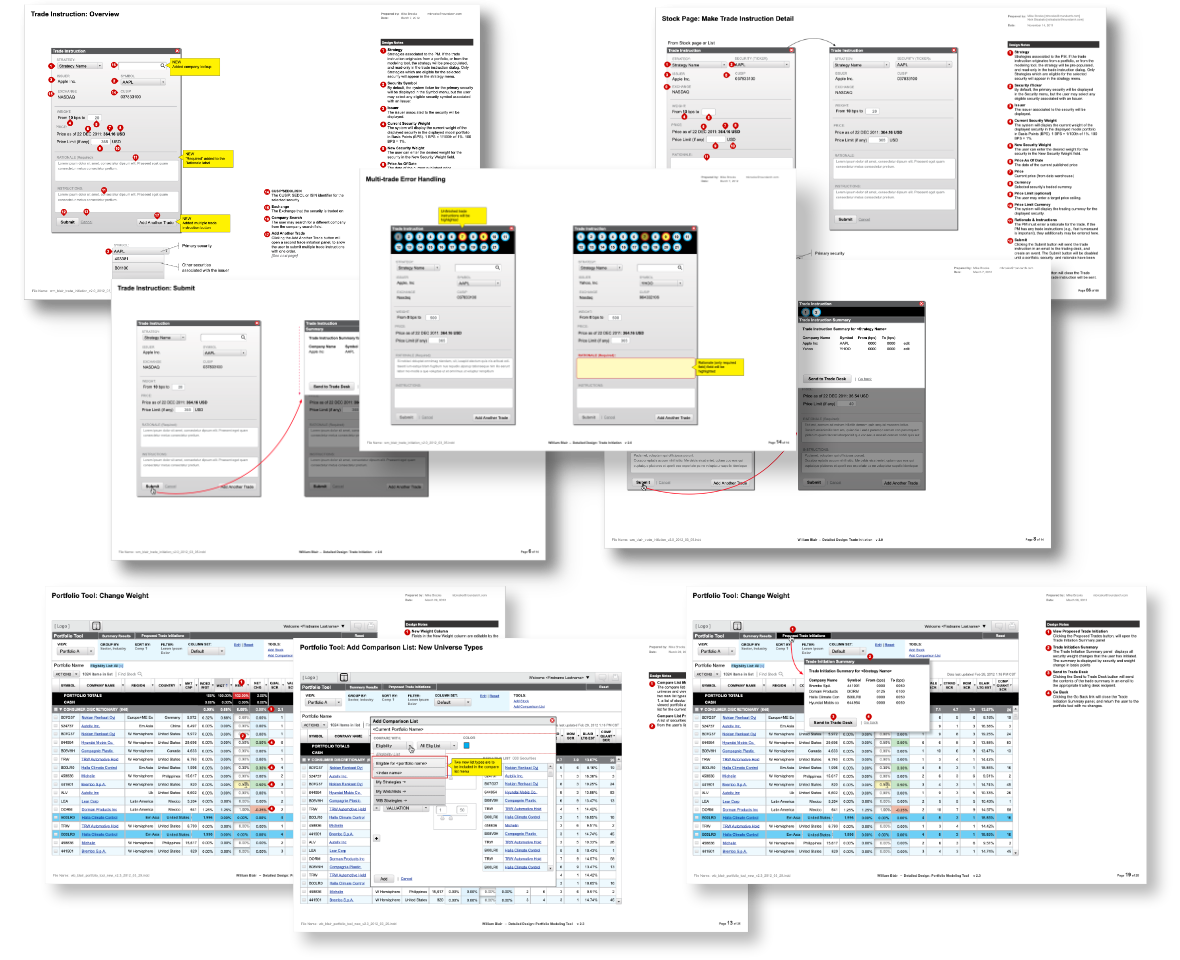
The Stock List framework was tied to specific contexts, such as the Eligibility universe, the Research Agenda, Portfolios and a range of standard reports. Base functionlality included filter, sort, group by, import, save views, export,
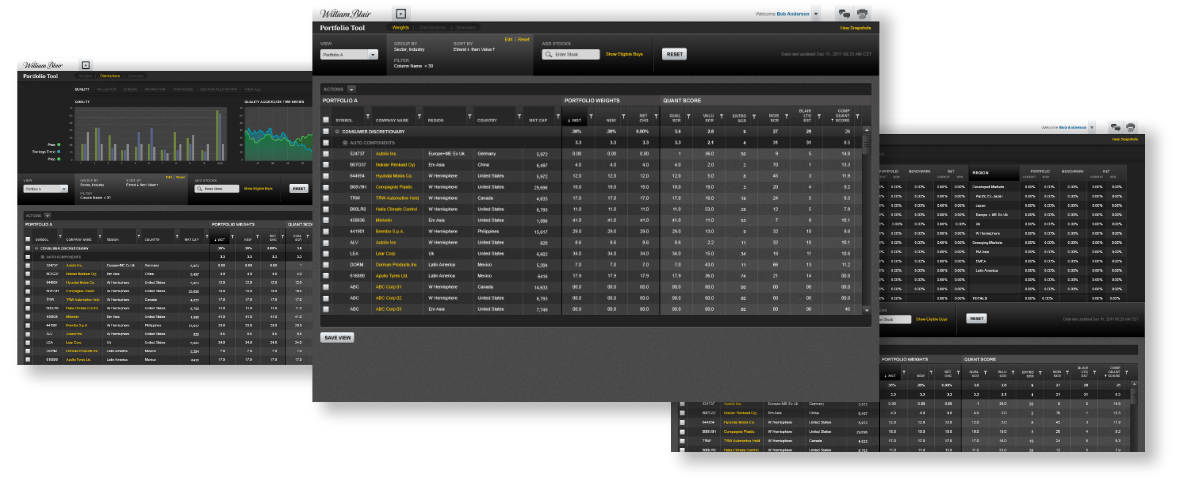
The Portfolio Tool was an extension of stock list functionality, but with added features such as, view by security rather than issuer, portfolio-based column sets, ability to change portfolio weight, ability to add comparison securities and watchlists.
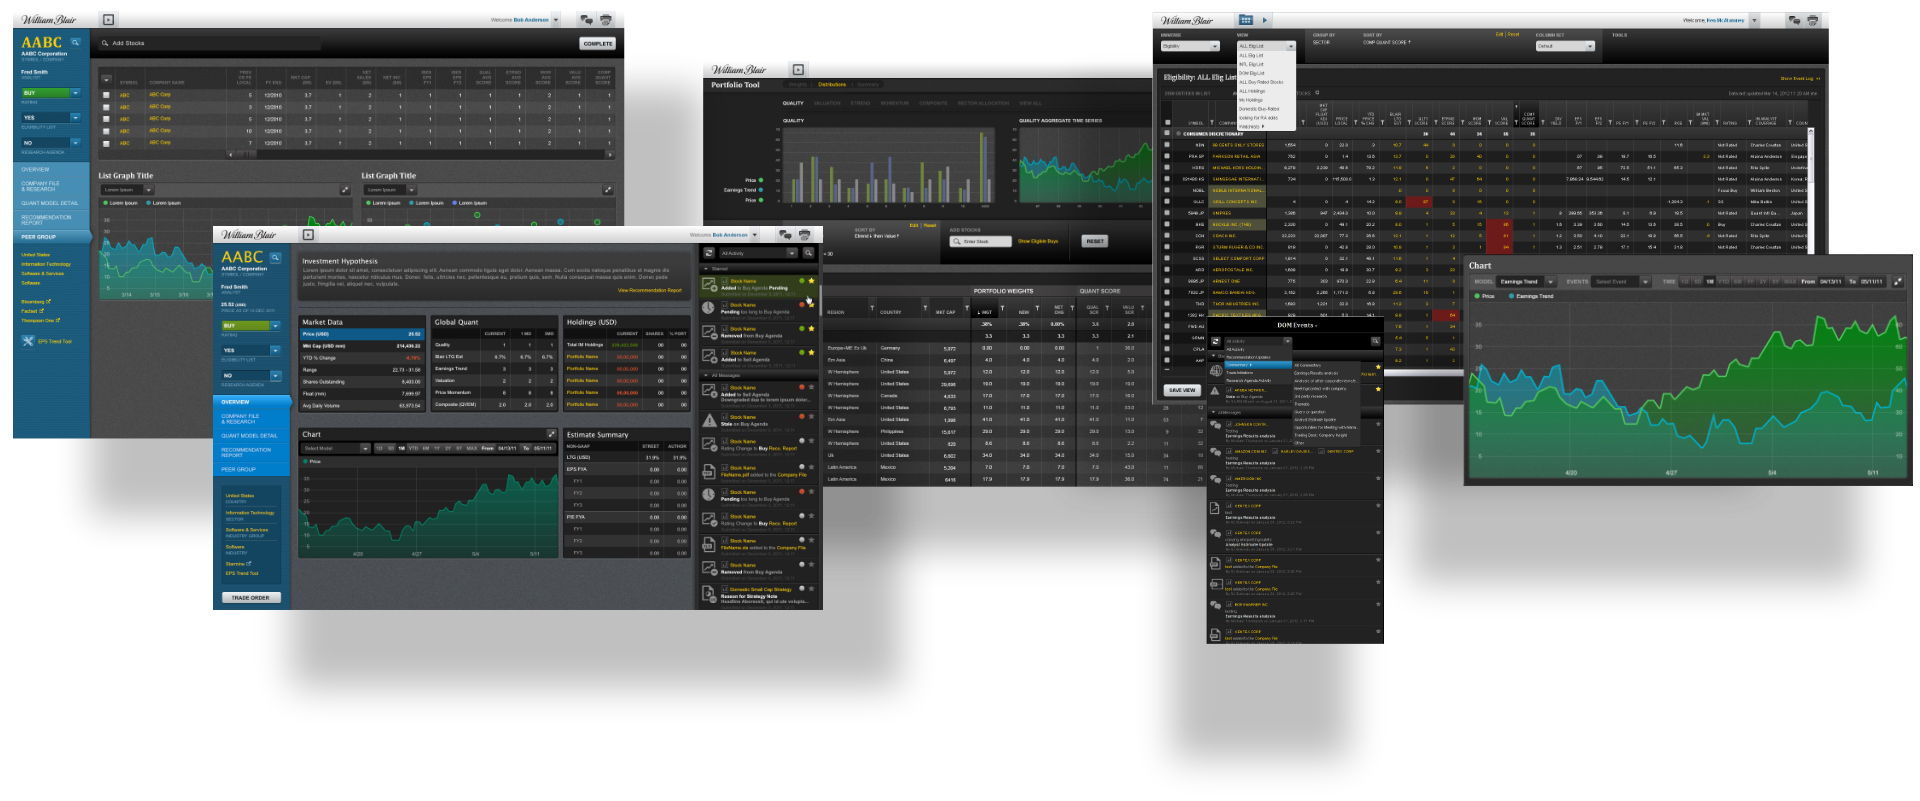
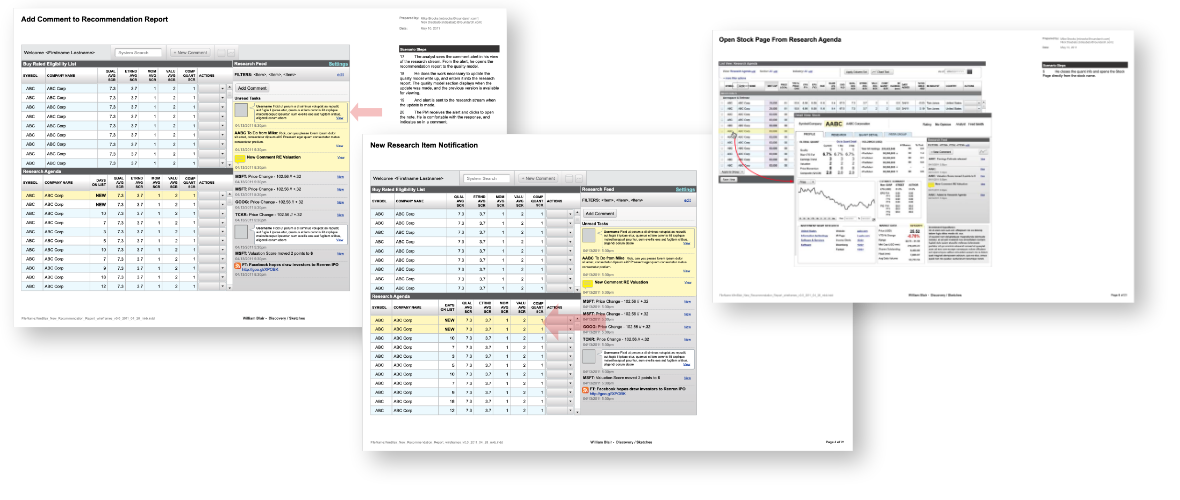
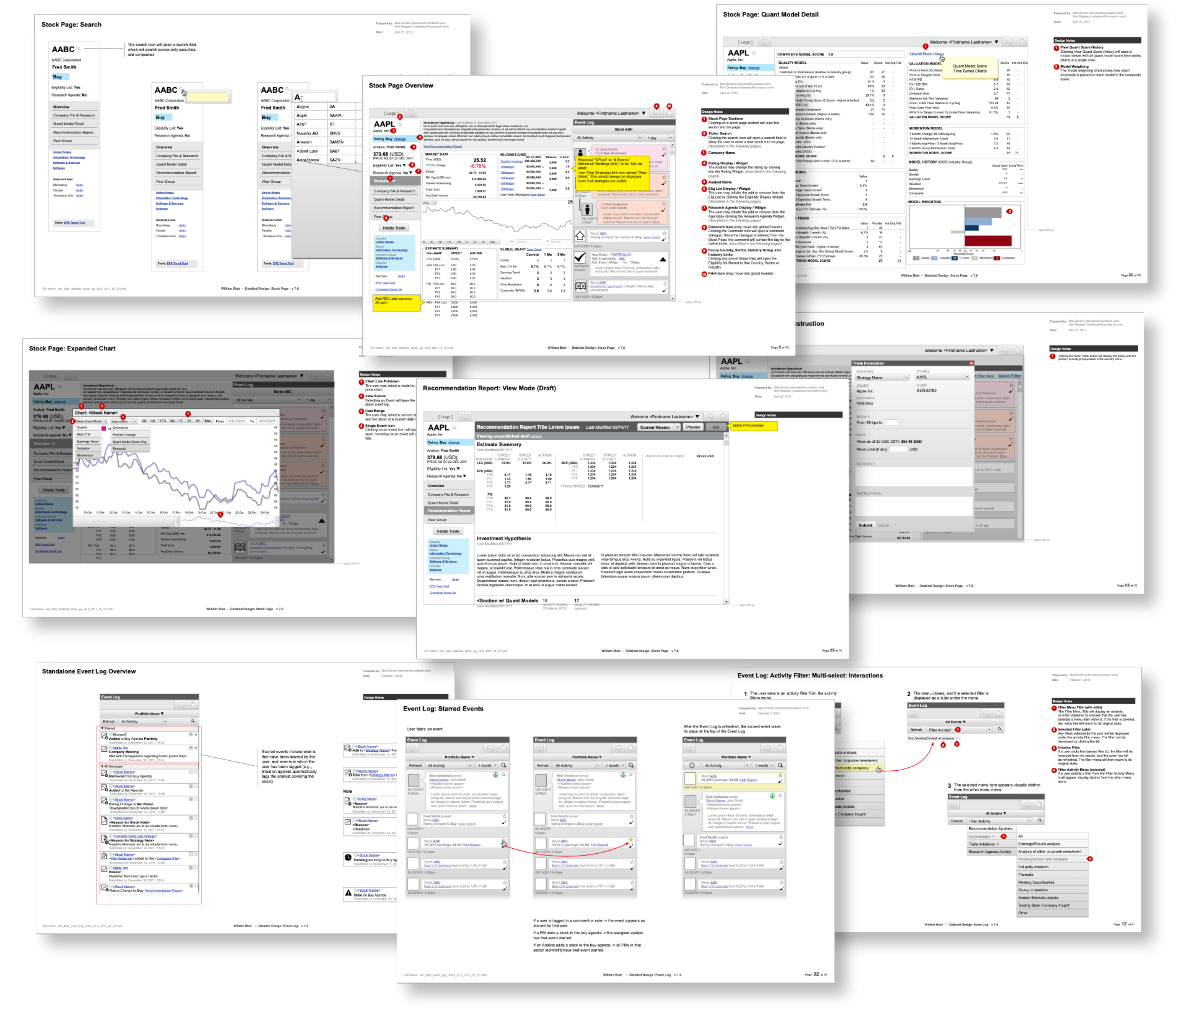
The Stock Page is a hub for all internal and street information about a particular issuer name. An Event Log filtered to commentary tagged with the issuer name, plus in-page navigation to quality, price, position, information, and the ability to launch a list of contextual near-neighbor stocks fpr comparison (e.g., sector, industry) amongst other features.
As the wireframes for the main components were being solidified, the visual design continued to evolve.
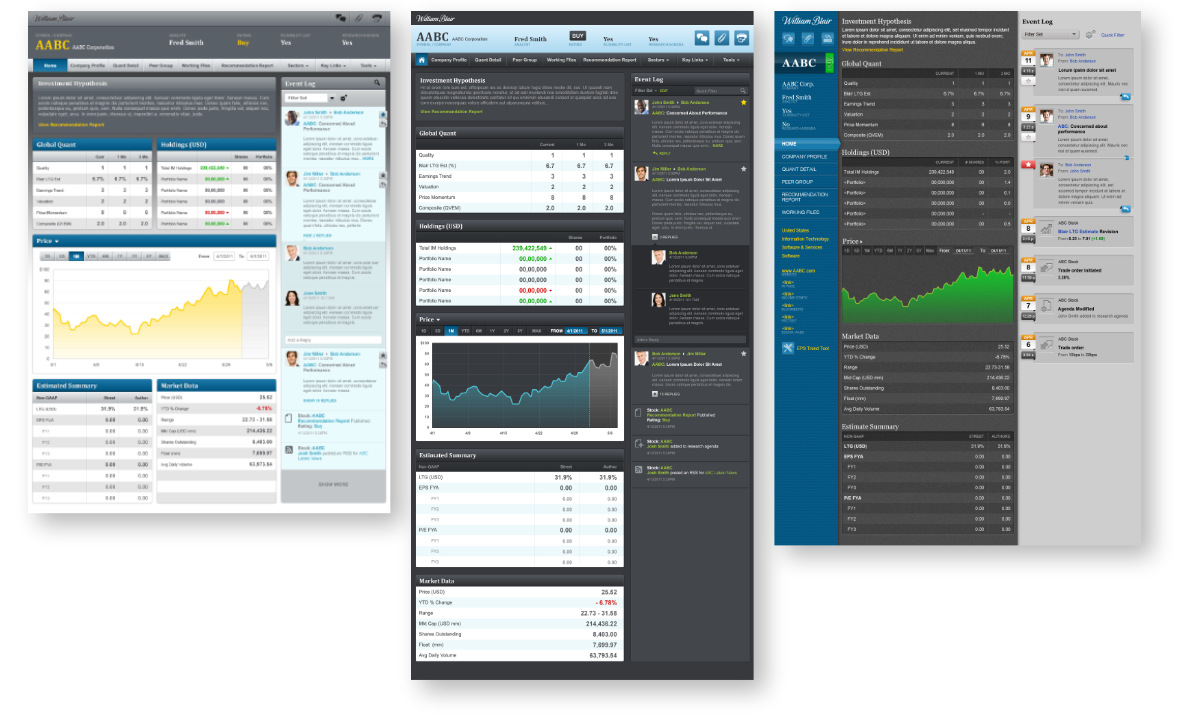
The Stock Page is the informational hub for a securities issuer. On it, a user can access all company and external research (such as sell-side or company-published), quant models, has the ability to update and create, Recommendation Reports, have visibility into any lists it is a member of, such as portfolios, the Eligibility List, the Research Agenda, or any user-created watchlists.
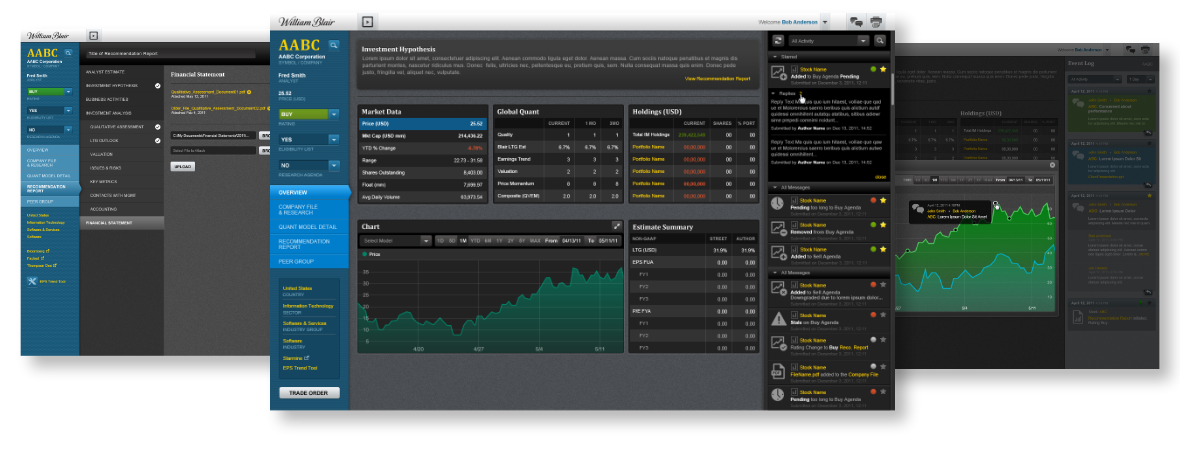
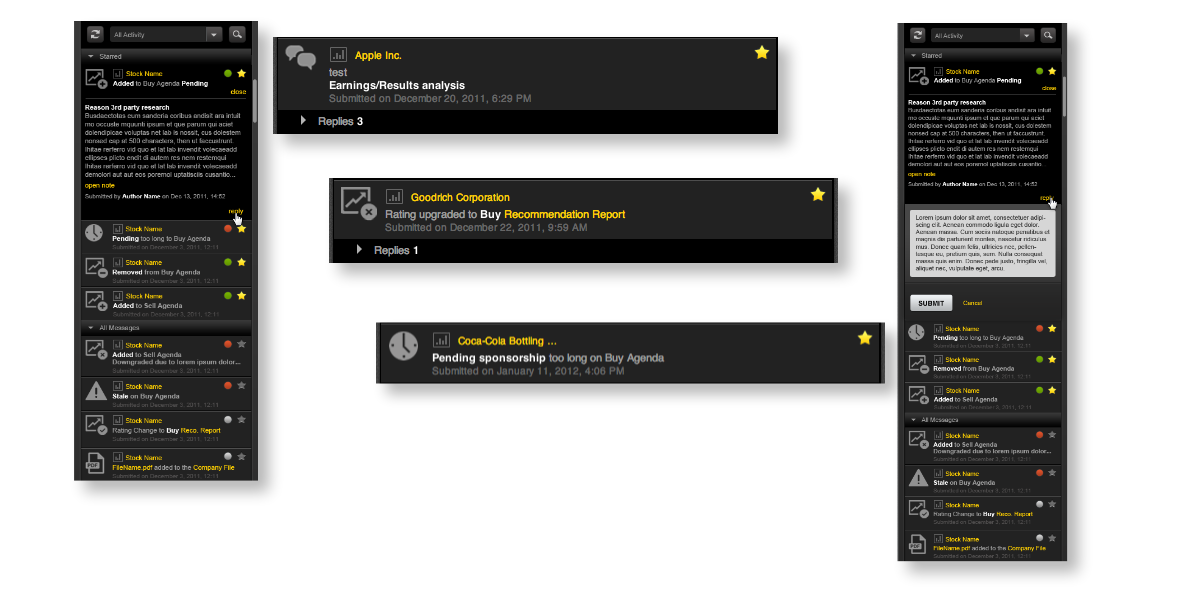
The stand-alone or Stock Page-embedded Event Log, is an activity hub, displaying securities-based commentary, ratings changes, position changes, conversation and opinion to an from the investment team.
The Stock List has several standard displays, such as the Research Agenda, and the Eligibility List. Analysts and Portfolio Managers can also save custom watchlists, custom filtered views or subsets of any of the above. This was a great improvement from the static Chrystal reports pulled overnight.
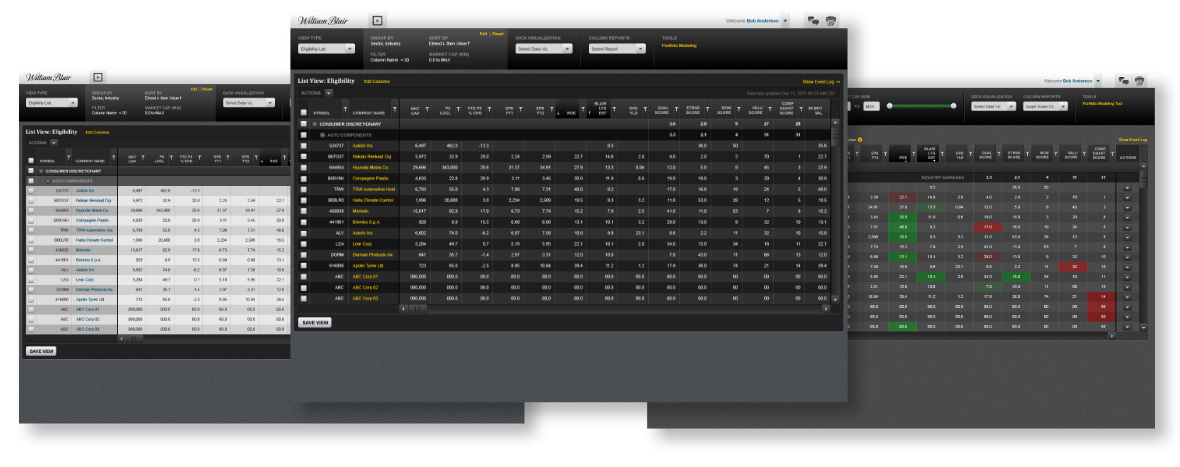
The Portfolio Tool has all of the functionality of the Stock List, with added portfolio-based features such as the ability to view weights, distribution, and quality charts, valuation and sector, region, and market cap summaries.